plt.figure(figsize=(10, 9))
# 상단: 전체 데이터와 탐지 결과
plt.subplot(3, 1, 1)
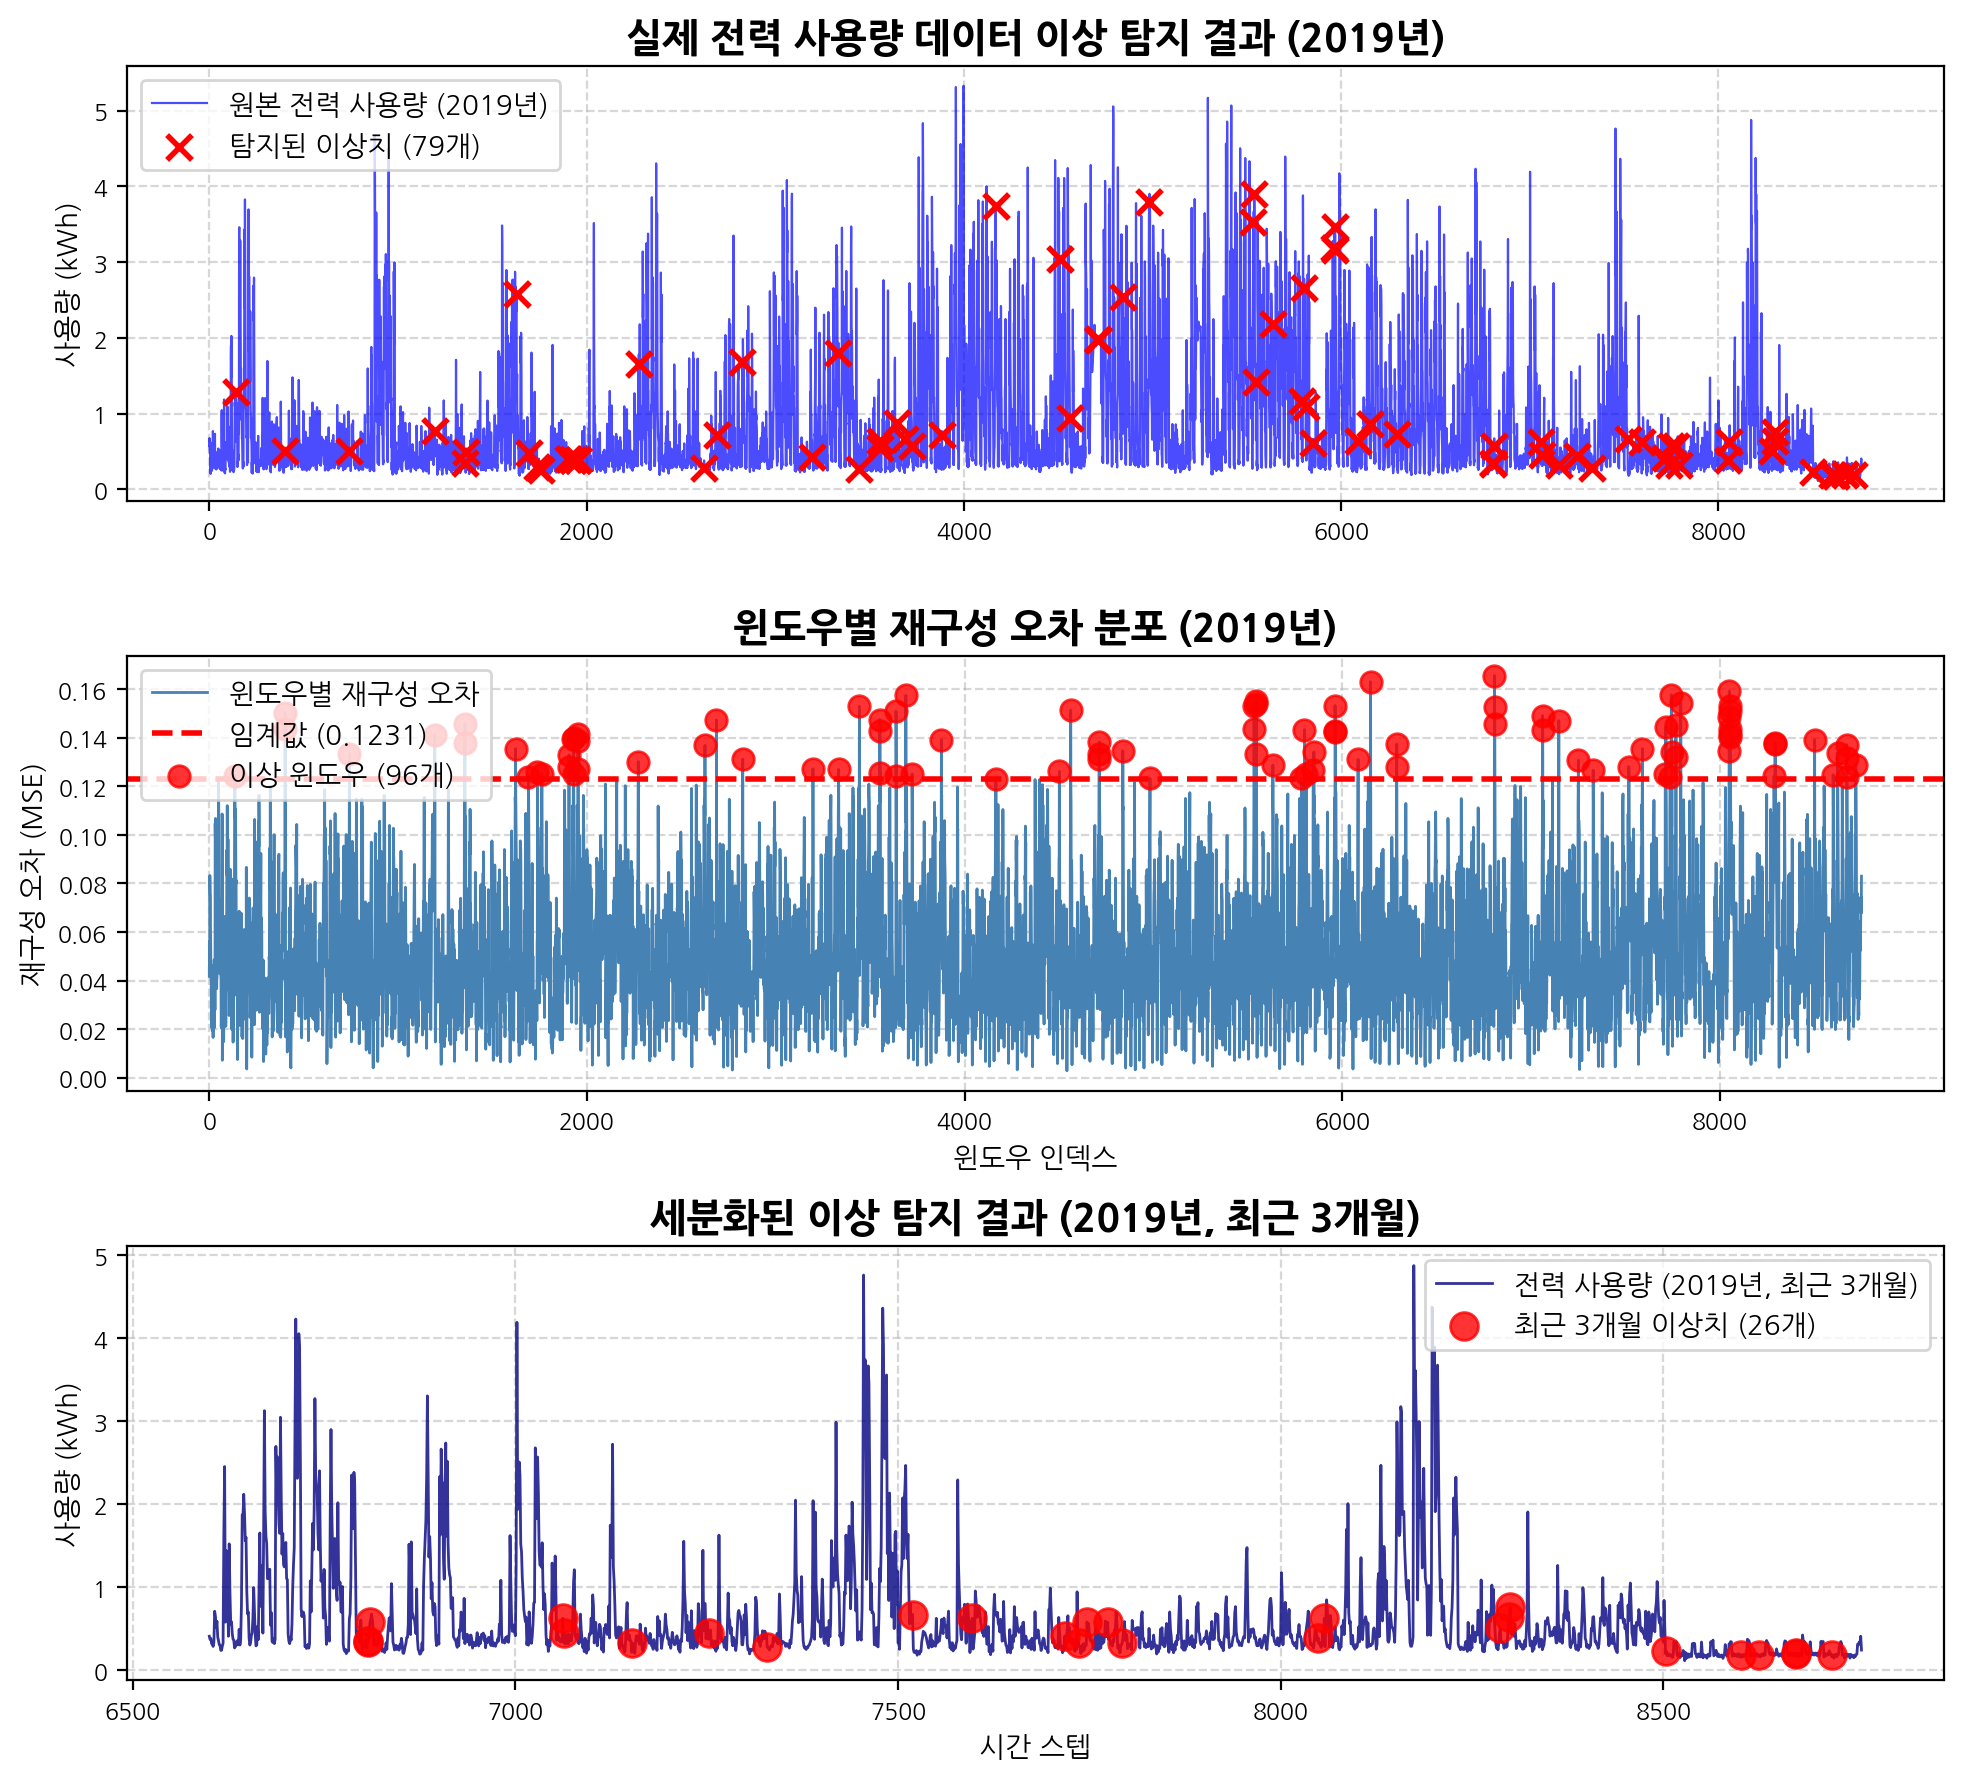
plt.plot(raw_data, label='원본 전력 사용량 (2019년)', alpha=0.7, color='blue', linewidth=0.8)
if predicted_anomaly_points:
plt.scatter(predicted_anomaly_points, raw_data[predicted_anomaly_points],
color='red', marker='x', s=80, linewidth=2, label=f'탐지된 이상치 ({len(predicted_anomaly_points)}개)', zorder=5)
plt.title('실제 전력 사용량 데이터 이상 탐지 결과 (2019년)', fontsize=14, fontweight='bold')
plt.ylabel('사용량 (kWh)')
plt.legend()
plt.grid(True, linestyle='--', alpha=0.5)
# 중간: 재구성 오차와 임계값
plt.subplot(3, 1, 2)
plt.plot(reconstruction_error, label='윈도우별 재구성 오차', color='steelblue', linewidth=1)
plt.axhline(y=threshold, color='red', linestyle='--', linewidth=2, label=f'임계값 ({threshold:.4f})')
if anomaly_window_indices.any():
plt.scatter(anomaly_window_indices, reconstruction_error[anomaly_window_indices],
c='red', s=60, alpha=0.8, label=f'이상 윈도우 ({len(anomaly_window_indices)}개)', zorder=5)
plt.title('윈도우별 재구성 오차 분포 (2019년)', fontsize=14, fontweight='bold')
plt.xlabel('윈도우 인덱스')
plt.ylabel('재구성 오차 (MSE)')
plt.legend()
plt.grid(True, linestyle='--', alpha=0.5)
# 하단: 세분화된 구간 시각화 (맨 뒤 3개월치 데이터)
plt.subplot(3, 1, 3)
month_hours = 90 * 24
start_idx_viz = max(0, len(raw_data) - month_hours)
end_idx_viz = len(raw_data)
plt.plot(range(start_idx_viz, end_idx_viz), raw_data[start_idx_viz:end_idx_viz],
label=f'전력 사용량 (2019년, 최근 3개월)', alpha=0.8, color='navy', linewidth=1)
month_anomalies = [i for i in predicted_anomaly_points if start_idx_viz <= i < end_idx_viz]
if month_anomalies:
plt.scatter(month_anomalies, raw_data[month_anomalies],
color='red', marker='o', s=100, alpha=0.8,
label=f'최근 3개월 이상치 ({len(month_anomalies)}개)', zorder=5)
plt.title('세분화된 이상 탐지 결과 (2019년, 최근 3개월)', fontsize=14, fontweight='bold')
plt.xlabel('시간 스텝')
plt.ylabel('사용량 (kWh)')
plt.legend()
plt.grid(True, linestyle='--', alpha=0.5)
plt.tight_layout()
plt.show()
# 탐지 결과 요약 출력
print(f"\n=== 이상 탐지 결과 요약 (2019년) ===")
print(f"분석 데이터 길이: {len(raw_data):,} 시간")
print(f"전체 탐지된 이상치: {len(predicted_anomaly_points)}개")
print(f"최근 3개월 구간 이상치: {len(month_anomalies)}개")
print(f"이상치 비율: {len(predicted_anomaly_points) / len(raw_data) * 100:.3f}%")