import matplotlib.pyplot as plt
# --- 1. 최적 파라미터로 데이터 준비 ---
print(f"데이터 길이: {len(data)}, Optuna가 찾은 최적 윈도우 크기: {best_window_size}")
# 윈도우 생성 및 정규화
optimal_raw_windows = create_sliding_windows(data, best_window_size)
# 윈도우 생성 실패 시 폴백 로직
if len(optimal_raw_windows) == 0:
print(f"경고: 윈도우 크기 {best_window_size}로 윈도우를 생성할 수 없습니다. 더 작은 크기로 재시도합니다.")
# 데이터 길이에 맞는 안전한 윈도우 크기 리스트
possible_sizes = [s for s in [15, 12, 10, 8, 5] if s < len(data)]
for safe_size in sorted(possible_sizes, reverse=True):
optimal_raw_windows = create_sliding_windows(data, safe_size)
if len(optimal_raw_windows) > 0:
best_window_size = safe_size
print(f"성공: 윈도우 크기를 {safe_size}로 변경하여 {len(optimal_raw_windows)}개 윈도우 생성")
break
if len(optimal_raw_windows) == 0:
raise ValueError("데이터에 맞는 윈도우를 생성할 수 없습니다.")
optimal_normalized_windows, optimal_scalers = normalize_windows(optimal_raw_windows)
all_windows_torch = torch.from_numpy(optimal_normalized_windows).unsqueeze(1).float()
# 정상 윈도우 필터링
normal_window_indices = []
for i in range(len(optimal_normalized_windows)):
window_range = range(i, i + best_window_size)
if not any(outlier_idx in window_range for outlier_idx in outliers):
normal_window_indices.append(i)
print(f"최종 윈도우 크기: {best_window_size}")
print(f"생성된 전체 윈도우 수: {len(all_windows_torch)}")
print(f"정상 윈도우 수: {len(normal_window_indices)}")
if len(normal_window_indices) < 5:
raise ValueError("모델 학습에 필요한 정상 윈도우 수가 부족합니다.")
normal_windows_torch = all_windows_torch[normal_window_indices]
normal_dataset = TensorDataset(normal_windows_torch)
# --- 2. 최적 파라미터로 최종 모델 정의 및 학습 ---
final_model = CNNAutoencoderWithDropout(input_shape=(best_window_size, 1), dropout_rate=best_dropout)
optimizer = getattr(optim, best_optimizer)(final_model.parameters(), lr=best_lr)
criterion = nn.MSELoss()
full_normal_loader = DataLoader(normal_dataset, batch_size=min(16, len(normal_dataset)), shuffle=True)
epochs = 100
print("최종 모델 학습 시작...")
for epoch in range(epochs):
for data_batch in full_normal_loader:
inputs = data_batch[0]
optimizer.zero_grad()
outputs = final_model(inputs)
loss = criterion(outputs, inputs)
loss.backward()
optimizer.step()
if (epoch + 1) % 20 == 0:
print(f"Epoch [{epoch+1}/{epochs}], Loss: {loss.item():.6f}")
# --- 3. 임계값 설정 및 이상치 탐지 ---
final_model.eval()
# 학습 데이터(정상 윈도우)의 재구성 오차로 임계값 설정
with torch.no_grad():
if len(normal_windows_torch) > 0:
reconstructed_train = final_model(normal_windows_torch)
error_train = torch.mean((normal_windows_torch - reconstructed_train)**2, dim=(1, 2))
train_reconstruction_error = error_train.numpy()
quantile_level = 0.995
threshold = np.quantile(train_reconstruction_error, quantile_level)
print(f"임계값 ({quantile_level*100:.1f}% Quantile): {threshold:.6f}")
else:
quantile_level = "N/A"
threshold = 0.05
print(f"경고: 학습 데이터가 없어 고정 임계값을 사용합니다: {threshold}")
# 전체 데이터에 대한 재구성 오차 계산
with torch.no_grad():
reconstructed_all = final_model(all_windows_torch)
mean_error_per_window = torch.mean((all_windows_torch - reconstructed_all)**2, dim=(1, 2)).numpy()
pointwise_error = ((all_windows_torch - reconstructed_all)**2).squeeze().numpy()
anomaly_window_indices = np.where(mean_error_per_window > threshold)[0]
predicted_anomaly_points = []
for window_idx in anomaly_window_indices:
if window_idx < len(pointwise_error):
errors_in_window = pointwise_error[window_idx]
max_error_idx_in_window = np.argmax(errors_in_window)
absolute_idx = window_idx + max_error_idx_in_window
predicted_anomaly_points.append(absolute_idx)
predicted_anomaly_points = sorted(list(set(predicted_anomaly_points)))
print(f"탐지된 이상치 포인트 인덱스: {predicted_anomaly_points}")
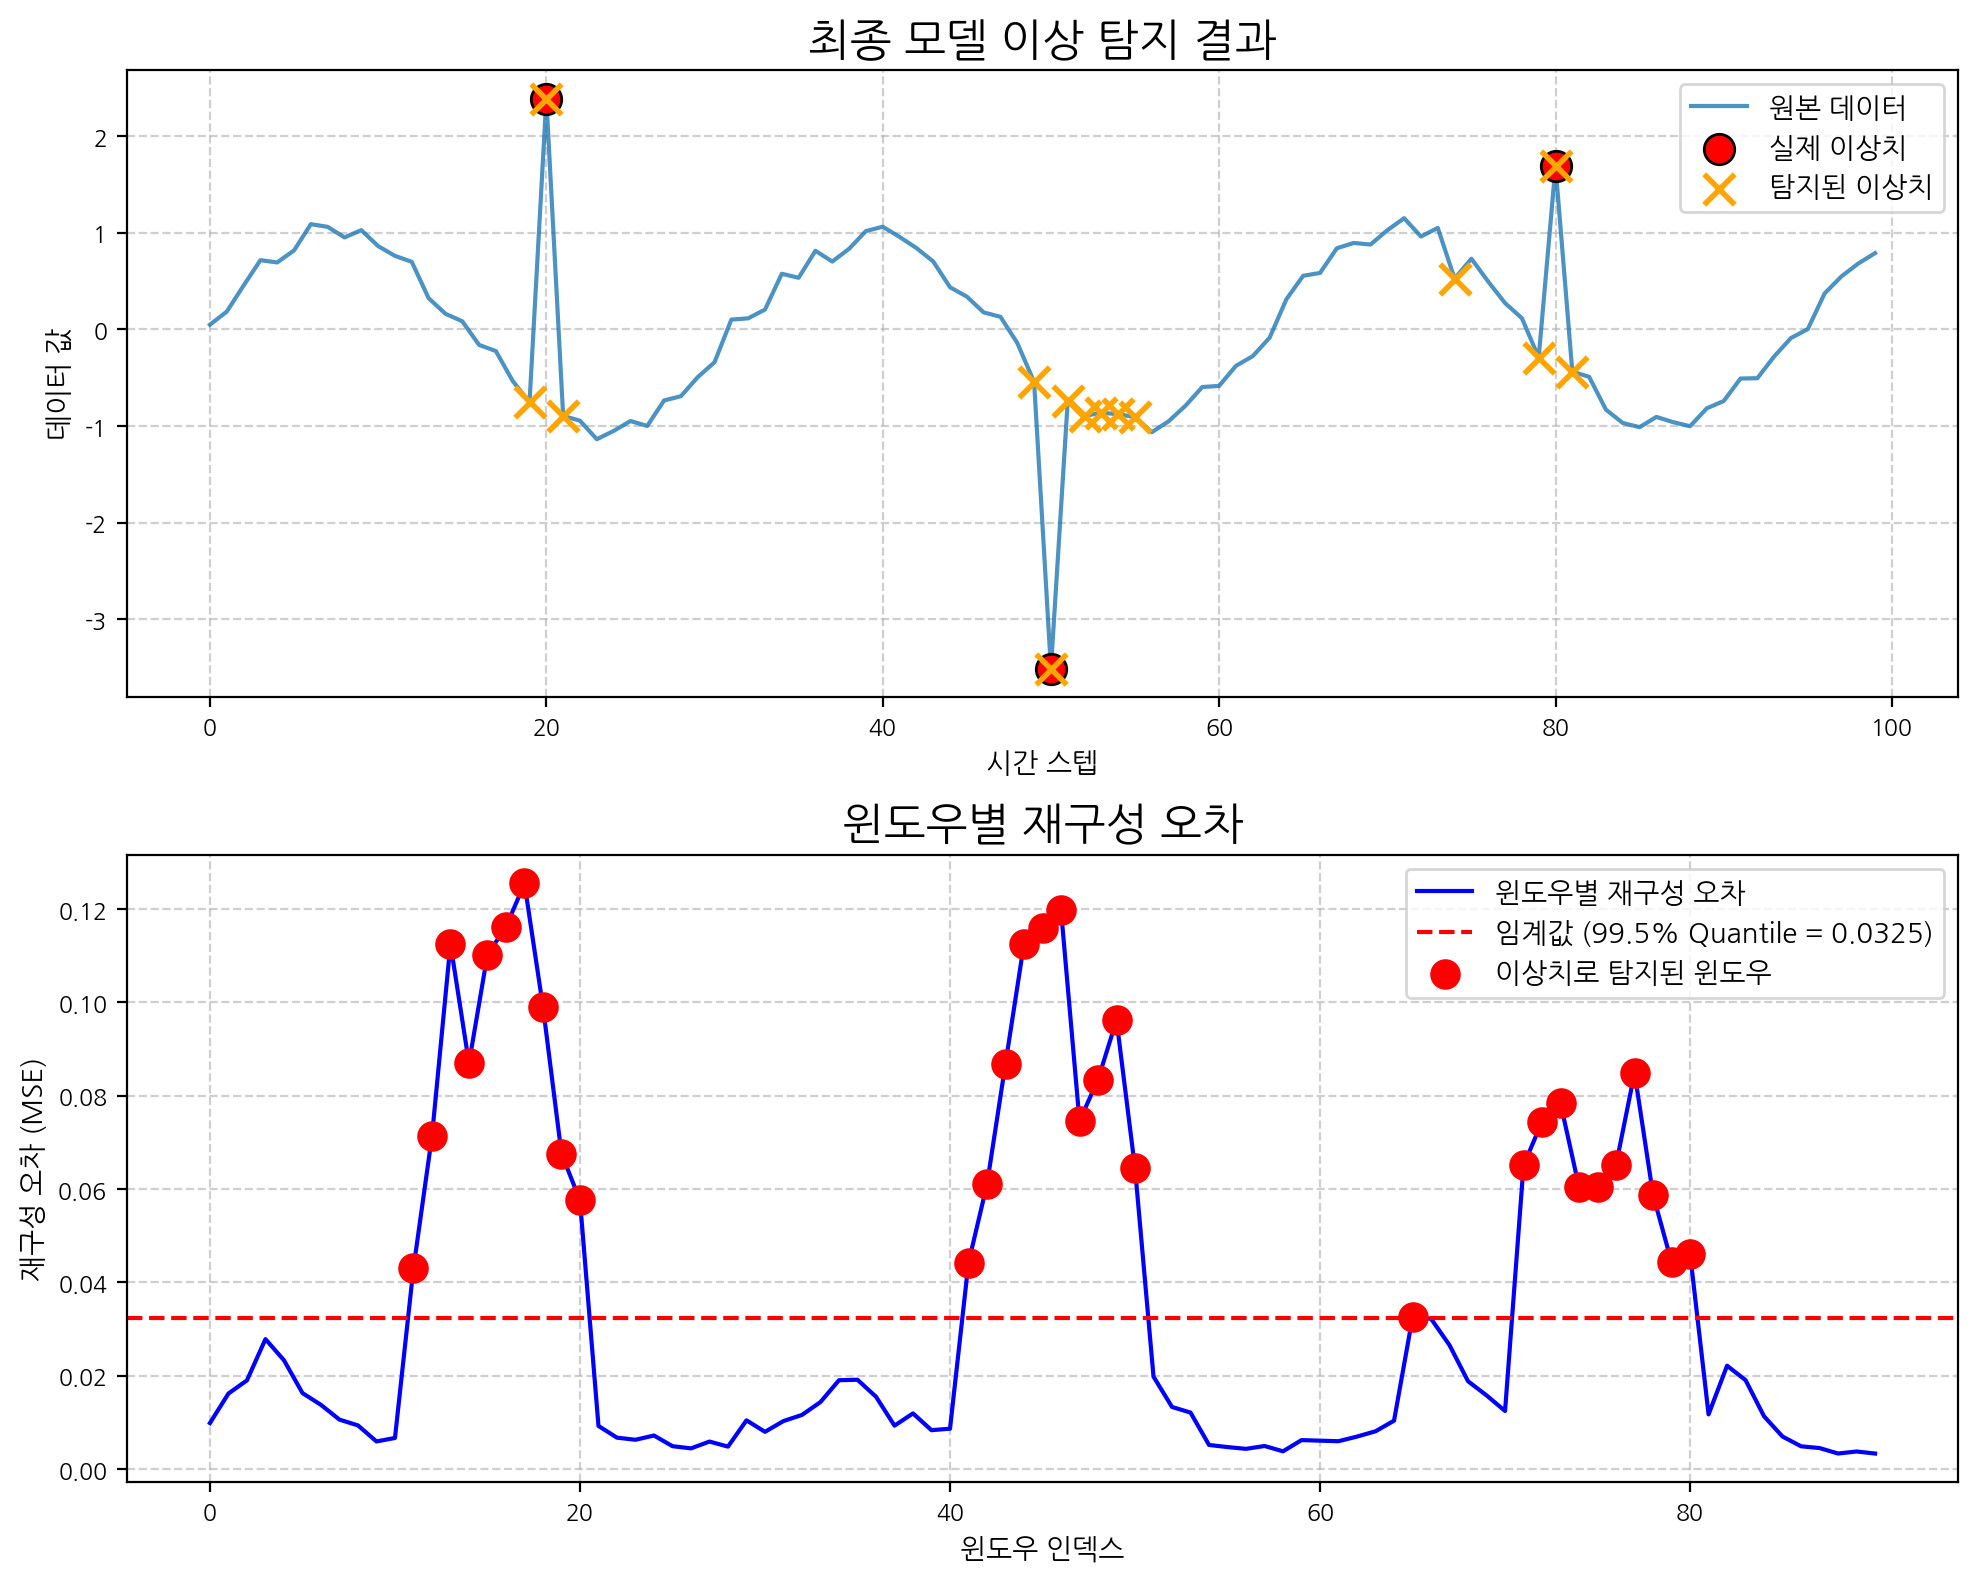
# --- 4. 결과 시각화 ---
plt.figure(figsize=(10, 8))
plt.subplot(2, 1, 1)
plt.plot(data, label='원본 데이터', alpha=0.8)
plt.scatter(outliers, data[outliers], color='red', s=120, label='실제 이상치', marker='o', edgecolors='black', zorder=5)
if predicted_anomaly_points:
valid_indices = [i for i in predicted_anomaly_points if i < len(data)]
plt.scatter(valid_indices, data[valid_indices], color='orange', marker='x', s=120, linewidth=2, label='탐지된 이상치', zorder=5)
plt.title('최종 모델 이상 탐지 결과', fontsize=16)
plt.xlabel('시간 스텝')
plt.ylabel('데이터 값')
plt.legend()
plt.grid(True, linestyle='--', alpha=0.6)
plt.subplot(2, 1, 2)
plt.plot(mean_error_per_window, label='윈도우별 재구성 오차', color='blue')
if quantile_level != "N/A":
threshold_label = f'임계값 ({quantile_level*100:.1f}% Quantile = {threshold:.4f})'
else:
threshold_label = f'고정 임계값 ({threshold:.4f})'
plt.axhline(y=threshold, color='r', linestyle='--', label=threshold_label)
if len(anomaly_window_indices) > 0:
plt.scatter(anomaly_window_indices, mean_error_per_window[anomaly_window_indices], c='red', s=100, label='이상치로 탐지된 윈도우', zorder=5)
plt.title('윈도우별 재구성 오차', fontsize=16)
plt.xlabel('윈도우 인덱스')
plt.ylabel('재구성 오차 (MSE)')
plt.legend()
plt.grid(True, linestyle='--', alpha=0.6)
plt.tight_layout()
plt.show()